
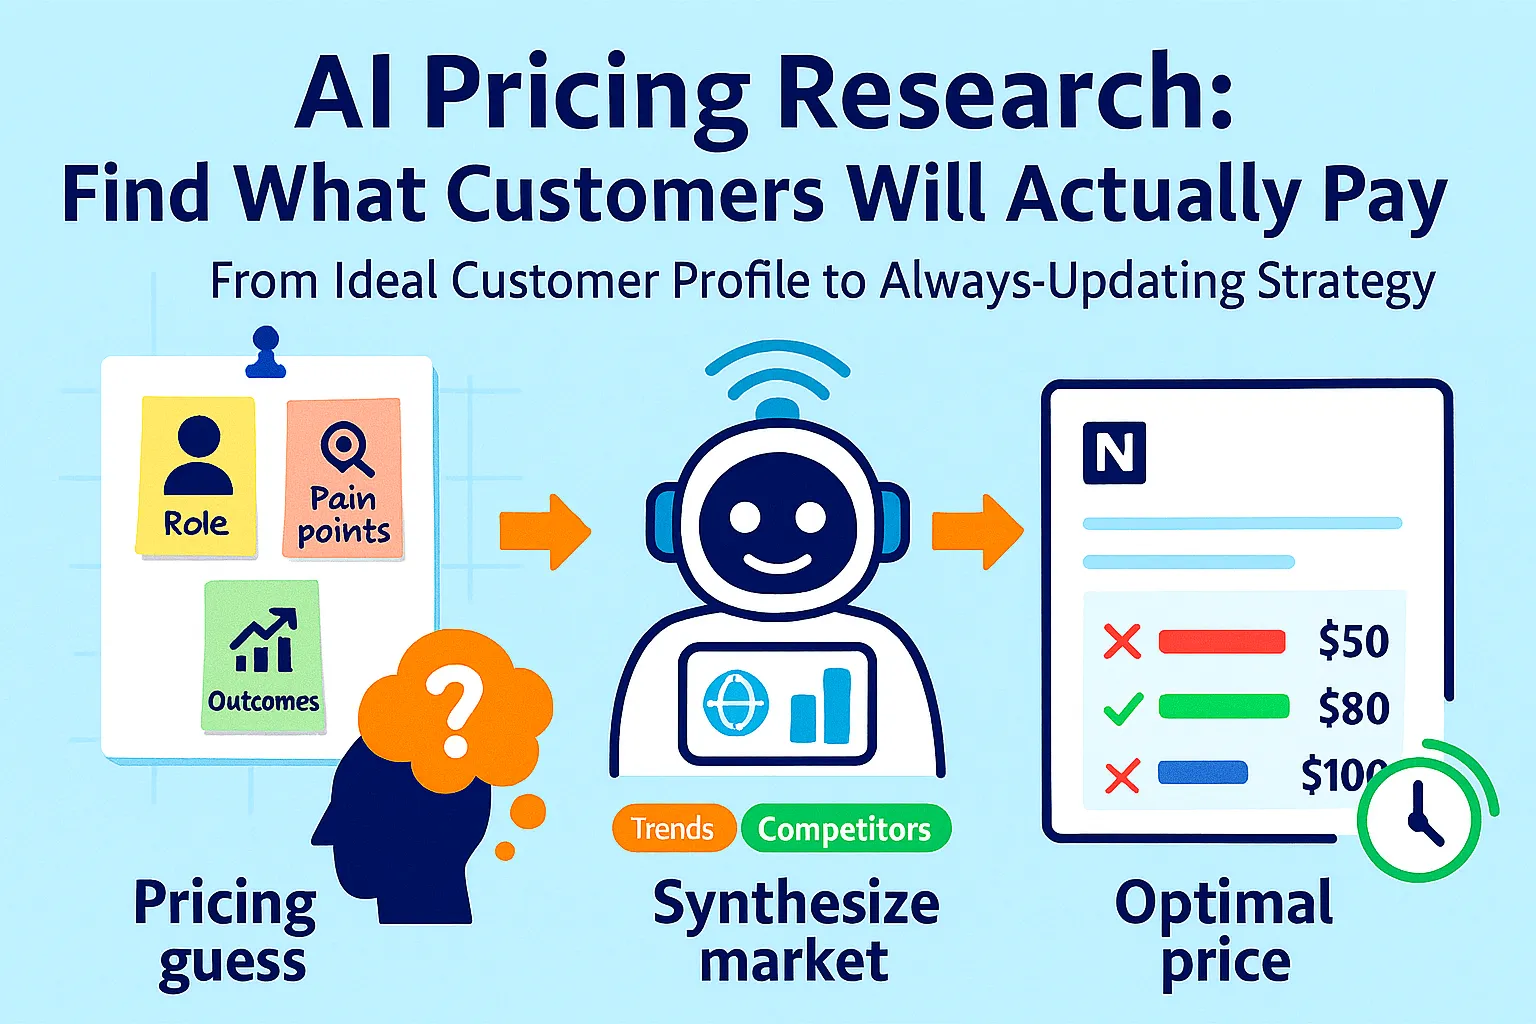
Most solo founders price their product one of two ways.
The first way: look at a competitor's pricing page, subtract 20%, and call it positioning. The second way: pick a number that feels right — not too expensive to scare people off, not so cheap it seems suspicious — and hope.
Neither is pricing research. Both are guessing with extra steps.
The result is predictable: you leave money on the table if you're cheap, you lose deals you shouldn't lose if you're expensive, and you have no systematic way to know which problem you have. You just watch conversion rates and MRR and form opinions that are impossible to verify.
Pricing is the highest-leverage decision a solo founder makes. A 10% improvement in pricing strategy produces a bigger revenue impact than a 10% improvement in acquisition, retention, or product quality. Yet it's the decision made with the least research, the most assumption, and the most anxiety.
The AI pricing research workflow changes this. It replaces guessing with a structured process: normalize what competitors actually charge (not what their marketing implies), generate hypotheses for your own pricing model across multiple structures, and run a lightweight test — a survey or landing page experiment — that reveals what your specific customers will actually pay before you commit to a number.
Here's how to build it.
The Three Lies Founders Tell Themselves About Pricing
Before the workflow, name the failure modes. They come up in every pricing conversation with solo founders.
Lie 1: "I'm cheaper than the competition, so I'm fine"
Cheaper is not inherently a competitive advantage — it's only an advantage if price is the primary purchase criterion for your ICP. For most B2B products, price is rarely the top criterion. Features, reliability, support, and brand trust outrank price in most purchase decisions. Pricing below the market signals lower value, not better deal. The customer's first question when they see a low price isn't "what a great deal" — it's "what's wrong with it?"
Lie 2: "I'll raise prices later once I prove myself"
This is the most expensive pricing mistake founders make. Raising prices on existing customers is harder than acquiring new customers at higher prices. Every customer acquired at your initial price becomes an anchor, an expectation, and a potential churn risk if you raise. Your initial pricing is not a placeholder — it sets the ceiling on what customers believe your product is worth.
Lie 3: "I'll know if my price is wrong because people won't buy"
Low conversion could mean your price is wrong. It could also mean your positioning is wrong, your ICP is wrong, your channel is wrong, or your copy is wrong. Price is one variable among many. You can't read willingness to pay from conversion rates alone — you need to isolate the signal.
The pricing research workflow isolates the signal.
Phase 1: Competitor Pricing Intelligence
The goal of competitor pricing research is not to copy. It's to understand the market's price anchors — the range customers have been educated to expect — and to identify where the gaps are.
Most founders do this by visiting a few pricing pages and forming impressions. The problem: pricing pages are marketing documents. The plans are named to imply a progression. The feature lists are curated to justify tiers. The "most popular" badge is placed strategically. None of it tells you what customers actually pay.
You need to normalize competitor pricing — strip away the marketing and compare structures apples-to-apples.
Step 1: Collect raw pricing data
For each of your top 5 competitors:
Visit their pricing page
Copy all plan names, prices, and feature bullets verbatim
Note: monthly vs. annual pricing, per-seat vs. flat vs. usage
Note: what's hidden (enterprise pricing, setup fees, support tiers)
Note: any promotional or "sale" pricing visible
Also check:
G2 or Capterra reviews mentioning price ("too expensive," "good value," "worth it") — these tell you customer perception, not just sticker price
Reddit/community discussions comparing prices ("I switched from X to Y and saved $200/month")
Step 2: The Competitor Pricing Normalization Prompt
I've collected pricing data from my top competitors.
Normalize and analyze it so I can understand the
market pricing structure clearly.

MY PRODUCT: [One sentence — what it does and for whom]

COMPETITOR PRICING DATA:
[Paste each competitor's pricing verbatim —
plan names, prices, feature lists]

Analyze and produce:

1. PRICING MODEL MAP
What pricing model does each competitor use?
- Flat rate (one price, all features)
- Tiered (good/better/best plans)
- Per-seat (price multiplies per user)
- Usage-based (price scales with consumption)
- Freemium (free tier + paid upgrade)
- Hybrid (combination)

Which model dominates this market?
What does that tell me about how customers
prefer to buy in this category?

2. NORMALIZED PRICE TABLE
Create a table comparing plans at equivalent
value levels across competitors:
| Competitor | Entry Plan | Mid Plan | Top Plan |
  Model | Annual Discount |

Identify the de facto entry price for this market
(what customers expect to pay to get started).

3. FEATURE GATE ANALYSIS
What features do competitors lock behind higher tiers?
For each feature type — storage, users, integrations,
analytics, support — what tier unlocks it?

Where are the consistent gates? (Features everyone
locks behind paid) — these are high perceived-value signals.

Where are the inconsistent gates? (One competitor
gives it free, others charge) — these are differentiation
opportunities.

4. PRICING GAPS
Is there an underserved price point?
(A gap between tiers with no option)

Is there a model no competitor is using that
could be advantageous?

Are any competitors obviously overpriced vs. value
delivered per their reviews?

5. WHAT THE MARKET HAS BEEN TRAINED TO EXPECT
Based on this data, what price range and structure
will prospects compare me against?
What is the "default mental model" a prospect
brings to my pricing page?

6. RED FLAGS FOR ME
Any pricing structure I should avoid based on
what you see in competitor reviews or community sentiment?
Step 3: The review sentiment scan
After normalization, run this on pricing-related reviews:
These are customer reviews that mention pricing
for products in my category.
Extract pricing intelligence.

REVIEWS: [Paste 10-15 reviews mentioning price
from G2/Capterra/Reddit]

Extract:

1. PRICE PERCEPTION
How do customers describe the pricing?
(Fair / expensive / confusing / good value /
worth it / frustrating)

2. WHAT THEY'RE COMPARING TO
When they say "expensive" or "cheap" —
compared to what?
(Another tool? The problem's cost? Their budget?)

3. WILLINGNESS-TO-PAY SIGNALS
Any mention of what they'd pay more for?
Any features called out as "worth paying for"?
Any plan they feel is unfairly priced?

4. CHURN ATTRIBUTION TO PRICE
Did any reviewers cite price as a reason they left?
Was it absolute price or value-for-price?

5. PRICE SENSITIVITY BY SEGMENT
Does price sensitivity seem to vary by company size
or role of reviewer?

Output: 3-5 actionable pricing insights from this
review set, ranked by signal strength.
This review scan is how you discover that "enterprise customers don't complain about price but SMBs consistently call it expensive" — which is a segmentation and positioning signal, not just a pricing signal.
Phase 2: Pricing Model Hypotheses
Now you understand the market. The next step is generating your own pricing hypotheses — not picking one model and committing, but building 3-4 credible options to evaluate.
The most important insight from research into bootstrapped SaaS pricing: pricing experimentation is the top growth lever for independent founders. Not acquisition. Not retention. Pricing. Companies implementing structured pricing experiments see 9-18% improvement in monetization compared to those that don't test.
The Model Selection Prompt:
Help me generate pricing model hypotheses for my product.

MY PRODUCT: [Description]
MY ICP: [Specific target customer]
MARKET PRICING CONTEXT: [Paste the summary from Phase 1]
MY CURRENT PRICE (if any): [X / "not launched yet"]

Generate 4 pricing model hypotheses:

HYPOTHESIS 1: FLAT RATE
A single price for all features.
- Recommended price point
- What's included
- Who this serves best
- Why a solo founder might prefer this model
- Revenue at 100 customers / path to $5K MRR
- Biggest risk

HYPOTHESIS 2: TIERED (Good/Better/Best)
Three plans at different price points.
- Plan names and prices
- Feature allocation across tiers
- Which tier should be "most popular" and why
- Psychological anchoring strategy
  (which plan makes the middle look like the obvious choice?)
- Revenue mix assumption (% of customers per tier)
- Biggest risk

HYPOTHESIS 3: USAGE-BASED
Price scales with a consumption metric.
- What's the consumption metric?
  (Seats / API calls / outputs / storage / projects)
- Why this metric aligns with value delivered
- Pricing per unit and minimum commitment
- Floor price (minimum charge to protect revenue floor)
- Revenue predictability risk:
  How variable could monthly revenue be?
- Biggest risk

HYPOTHESIS 4: HYBRID
A base subscription + usage component.
- Base price and what's included
- Usage component and pricing
- Why this balances predictability with upside
- How to communicate this without confusing prospects
- Biggest risk

For each model:
Score (1-5) on:
- Revenue predictability for solo founder
- Alignment with how ICP prefers to buy
- Sales simplicity (can I explain it in one sentence?)
- Scalability (does revenue grow without adding customers?)
- Competitive differentiation

RECOMMENDED MODEL: Which hypothesis to test first, and why.
The value metric question:
The single most important pricing decision is not the price — it's the value metric. The unit you charge for should directly correspond to the value customers receive. When this alignment breaks, customers feel overcharged even at fair prices.
Help me identify the right value metric for my product.

MY PRODUCT: [Description — what specifically it does]
VALUE DELIVERED: [What outcome customers get]
HOW USAGE VARIES: [Do some customers use it 10x more than others?]
ICP SOPHISTICATION: [Technical / Non-technical / Mixed]

For each potential value metric, evaluate:

OPTION 1: PER SEAT/USER
Alignment: Does value scale with number of users?
Adoption risk: Does per-seat pricing create friction
  to add users (hurting adoption)?
Competitive: Do competitors use this?

OPTION 2: PER OUTPUT UNIT
[e.g., per document, per report, per API call, per task]
Alignment: Does value scale with outputs produced?
Predictability: Can customers forecast their bill?
Complexity: Is the unit something they think about naturally?

OPTION 3: PER OUTCOME
[e.g., per ticket resolved, per lead generated, per hour saved]
Alignment: Strongest value alignment possible
Risk: Can you reliably measure outcomes?
Sales complexity: Can you prove the outcome reliably enough
  to charge for it?

OPTION 4: FLAT (no usage scaling)
Alignment: Best when all customers get similar value
Simplicity: Easiest to sell and understand
Risk: Undercharges heavy users, overcharges light users

RECOMMENDED METRIC: Which to use for initial pricing,
  why, and when to revisit.
Usage-based pricing became mainstream across 61% of SaaS companies for a reason: when price scales with value delivered, customers feel they're paying fairly regardless of their usage level. But for solo founders, usage-based pricing introduces revenue unpredictability — which is why the hybrid model (base + usage) is often the right answer: floor revenue is protected, upside captures heavy users.
Phase 3: Willingness-to-Pay Testing
You have competitor intelligence. You have pricing hypotheses. Now you need signal from your actual market — not what you think they'll pay, not what competitors charge, but what your specific ICP will open their wallet for.
Two testing methods. Pick one based on whether you have an existing audience.
Method A: The Pricing Survey (For Founders With an Existing Audience)
The Van Westendorp Price Sensitivity Meter is the most reliable survey methodology for willingness-to-pay research. It asks four questions that together reveal the "acceptable price range" — the range where customers don't feel cheated and don't feel suspicious.
The four questions:
At what price would this product be so cheap you'd question the quality?
At what price would this product be a bargain — great value for money?
At what price would this start to feel expensive, but you'd still consider it?
At what price would this be too expensive to consider?
Building the survey with AI:
Help me design a pricing survey for my product using
the Van Westendorp methodology.

MY PRODUCT: [Description]
MY ICP: [Specific customer description]
CONTEXT TO GIVE SURVEY RESPONDENTS:
[How will you explain what you're testing?
What should they know before answering?]

Generate:

1. SURVEY INTRODUCTION (50 words)
Explain what we're asking and why. Don't reveal
what you're hoping they'll say. Don't anchor
with a price range in the intro.

2. PRODUCT DESCRIPTION FOR SURVEY (100 words)
Describe the product's core value in terms
the ICP cares about. No feature lists.
Benefits and outcomes only.

3. VAN WESTENDORP QUESTIONS
Rewrite all four questions in natural language
appropriate for my ICP. Include appropriate
response format (open text with $ input,
or slider, or dropdown ranges).

4. FOLLOW-UP QUESTIONS (4-5 max)
To contextualize the pricing data:
- Current spending on related tools
- Team size / company size (for segmentation)
- How they found us
- One open question: "What would make this
  clearly worth [mid-range price] to you?"

5. DISTRIBUTION PLAN
Where to send this survey to reach my ICP.
What response count gives reliable signal
(minimum viable sample size for this research).

6. ANALYSIS INSTRUCTIONS
After collecting responses, how to interpret
the four price points to find:
- Point of Marginal Cheapness (PMC)
- Point of Marginal Expensiveness (PME)
- Optimal Price Point (OPP)
- Acceptable Price Range (APR)
Analyzing survey results:
Once you have 30+ responses (minimum), run:
Analyze these Van Westendorp pricing survey results.

MY PRODUCT: [Description]
NUMBER OF RESPONSES: [N]

RESPONSES:
Too cheap (quality concern): [List all responses]
Bargain price: [List all responses]
Starting to feel expensive: [List all responses]
Too expensive: [List all responses]

Calculate and interpret:
1. POINT OF MARGINAL CHEAPNESS (PMC):
   Price where "too cheap" responses first exceed
   "bargain" responses going upward

2. POINT OF MARGINAL EXPENSIVENESS (PME):
   Price where "too expensive" responses first exceed
   "starting to feel expensive" going upward

3. OPTIMAL PRICE POINT (OPP):
   Intersection of "too cheap" and "too expensive" curves

4. ACCEPTABLE PRICE RANGE (APR):
   Between PMC and PME

5. SEGMENTATION:
   Do the ranges differ significantly by
   [company size / role / current tools]?

6. PRICING RECOMMENDATION:
   Given this data and my pricing hypotheses:
   - What price to launch at?
   - What price to test next?
   - Is there evidence for tiered pricing
     (different segments show different WTP)?

7. WHAT TO WATCH OUT FOR:
   Any anomalies in the data?
   Any segment where WTP seems significantly
   different from the average?
Method B: The Landing Page Price Test (For Pre-Launch or No Existing Audience)
If you don't have a list to survey, you test price on a landing page with real traffic. This is more work upfront but produces behavioral data (did they try to buy?) rather than stated preferences (what they say they'd pay) — which is more reliable.
The two-version test:
Build two versions of your landing page with different price points. The only variable that changes is the price. Everything else — headline, positioning, features, CTA — stays identical.
The price gap should be meaningful: test $29 vs. $79, or $49 vs. $149, not $29 vs. $35. A small gap won't produce a clear signal.
The landing page price test design prompt:
Help me design a pricing A/B test for my product landing page.

MY PRODUCT: [Description]
MY ICP: [Who this is for]
PRICING HYPOTHESIS A: $[X]/month
PRICING HYPOTHESIS B: $[Y]/month
MY CURRENT CONVERSION RATE (if known): [X%]
EXPECTED MONTHLY TRAFFIC: [estimated visits/month]

Design the test:

1. WHAT TO KEEP IDENTICAL
List every element that must stay constant
between versions to isolate the price variable.

2. WHAT TO CHANGE
How to display the price on each version.
Should the CTA change with the price
(e.g., "Start for $29" vs. "Start for $79")
or stay neutral ("Get Started")?
Note: changing CTA introduces another variable.

3. SAMPLE SIZE CALCULATION
How many visitors do I need per version
to reach 95% statistical confidence?
(Use: current conversion rate assumption of 3%
if unknown, minimum detectable effect of 20%)

4. DURATION ESTIMATE
At [estimated traffic/month], how long
will this test take to reach significance?

5. WHAT TO MEASURE
Primary metric: Conversion to [trial / purchase / waitlist]
Secondary metrics: Time on page, scroll depth,
  bounce rate (do higher prices scare people off
  before they even read?)

6. HOW TO INTERPRET RESULTS
If Version A ($X) converts significantly better:
  [interpretation]
If Version B ($Y) converts similarly to Version A:
  [interpretation — what this tells you about
  price elasticity]
If Version B converts better:
  [what this means and what to test next]
If no significant difference:
  [what to do]

7. TRAFFIC SOURCE RECOMMENDATION
Where to drive traffic to get the cleanest signal
for this test, given my ICP.
The landing page copy test (which price to make more compelling):
Once you've picked a price based on testing, optimize how it's framed:
I've settled on a price of $[X]/month for my product.
Help me write pricing page copy that makes this price
feel like an obvious decision.

MY PRODUCT: [Description]
MY ICP: [Description]
WHAT THEY CURRENTLY PAY FOR THE PROBLEM:
[Tools they use, staff they hire, or time they spend]
PRICE: $[X]/month (or annual equivalent: $[Y]/year)
COMPETITORS' PRICES: [Range]

Generate:

1. VALUE ANCHOR STATEMENT
One sentence that reframes $X/month against
the alternative cost.
(e.g., "Less than one hour of a contractor's time,
replaces 10 hours of weekly work")

2. ANNUAL DISCOUNT FRAMING
If offering annual pricing:
How to present the discount to maximize
annual plan adoption without making monthly
look overpriced.

3. PLAN NAMES (if tiered)
Names that communicate value progression,
not just size.
(Starter/Growth/Scale is overused —
what names reflect what each plan does?)

4. FEATURE TIER LOGIC
For a good/better/best structure:
Which features belong in each tier and why?
What's the "forcing function" feature —
the one feature that makes the upgrade obvious
when a customer hits the limit?

5. RISK REVERSAL
What guarantee, trial, or return policy
makes the price feel safe to try?
What is standard in this market?

6. FAQ ENTRIES FOR PRICING OBJECTIONS
The 4-5 most common pricing objections for
this type of product, with direct answers.
Phase 4: The Ongoing Pricing Intelligence System
Pricing research isn't one-time. Your competitive landscape shifts. New models emerge. Customer expectations evolve. Pricing experimentation is the top growth lever for bootstrapped founders — but only if you treat it as ongoing, not as a launch decision.
The quarterly pricing review (45 minutes):
Part 1: Competitive re-scan (15 minutes)
Set a calendar reminder every 3 months to re-visit competitor pricing pages. You're looking for:
Any price changes (up or down)
New tier additions or removals
Model changes (did anyone switch from per-seat to flat?)
New competitors entering with aggressive pricing
Here are the latest pricing pages from my competitors.
My last competitive pricing analysis was [date].
Here's what has changed: [describe changes]

Tell me:
1. Is my current pricing still positioned appropriately?
2. Did any competitor change suggest a market shift
   I should respond to?
3. Any new gap created by their changes I can exploit?
4. Should I change anything, and if so, what specifically?
Part 2: Customer pricing signals (15 minutes)
Pull from your CRM or notes:
Any deals lost specifically citing price ("went with X because it's cheaper")
Any upgrade/downgrade patterns in the last quarter
Any customers asking about pricing tiers they're not on
Any expansion revenue (customers paying more than initial plan)
Here are pricing-related signals from my customer data
in the last quarter:

DEALS LOST TO PRICE: [List with context]
DOWNGRADES: [List with reason if known]
UPGRADES: [List — what triggered them?]
QUESTIONS ABOUT OTHER PLANS: [What customers asked]
EXPANSION REVENUE: [Any customers on higher tiers than when they started]

Synthesize:
1. Is price sensitivity increasing or decreasing?
2. Are customers moving toward higher or lower tiers?
3. Any segment showing unusual price behavior?
4. One pricing hypothesis to test next quarter based on this data.
Part 3: Monetization hypothesis for next quarter (15 minutes)
Based on competitive re-scan and customer signals, run:
Here is my current pricing and what I've learned
from the last 3 months.

CURRENT PRICING: [Description]
COMPETITIVE CHANGES: [From Part 1]
CUSTOMER SIGNALS: [From Part 2]
CURRENT MRR AND TREND: [X, growing/flat/declining]

Generate one pricing experiment to run next quarter:
- What to test
- Why this hypothesis
- How to test it (pricing page, survey, or direct customer conversations)
- What result would confirm or refute it
- Risk if the test performs poorly
The compounding effect: one pricing improvement per quarter, each building on the last. That's the path from "number that felt right" to a defensible, evidence-based pricing strategy.
The Pricing Research Document
All of this goes in a Notion page: "Pricing Intelligence — [Product]"
Sections:
Current Pricing What you charge, why, when it was last updated, what test informed it.
Market Pricing Map Normalized competitor table from Phase 1. Updated quarterly.
Pricing Hypotheses All models generated in Phase 2. Status: Tested / Active / Rejected.
WTP Research Survey or landing page test results, with dates and response volumes.
Customer Signals Log Running log of pricing-related customer feedback, deals lost to price, upgrade/downgrade events.
Quarterly Review Log What changed, what we tested, what we concluded, what we'll test next.
One rule: every pricing decision gets one line in the log. "Changed from $49 to $79 — June 2026 — based on landing page test showing equivalent conversion at higher price." No undocumented pricing changes. Pricing decisions compound — you need a record of what you tried and what happened.
Tools and Cost
Free ($0/month):
ChatGPT free or Claude free: All prompts
Google Forms or Tally free: Survey distribution
Carrd ($0-9/year) or Framer free: Landing page price test
G2/Capterra/Reddit (browser): Review and community mining
Notion free: Pricing intelligence document
Total: $0 — runs the full workflow
Recommended ($20-50/month):
ChatGPT Plus or Claude Pro ($20/month): Better model generation, faster analysis
Typeform Basic ($29/month): More professional survey experience, better logic
Total: $49/month
Scale tier ($100+/month):
ProfitWell Retain (free for <$10K MRR): Subscription analytics + pricing data
Wynter ($300/month for message testing): Quantitative pricing message testing with real ICP panels — overkill until you're optimizing at scale
Splitbee or Posthog (free tiers): Landing page A/B test analytics
Total: Varies
When to pay for Wynter: When you have a stable pricing structure and want to optimize messaging around it at scale, Wynter's panel testing gives you quantitative feedback from real target customers on your pricing page copy — worth it at $30K+ MRR.
Common Mistakes Solo Founders Make
1. Pricing based on cost instead of value
"My tool uses GPT-4 and it costs me $0.03 per query so I charge $0.05" is cost-plus pricing. It ignores what the output is worth to the customer. A query that saves 3 hours of analyst work is worth $150 regardless of what the compute cost. Price the outcome, not the infrastructure.
2. Skipping the annual plan
Annual pricing is one of the highest-ROI changes a solo founder can make. Offering a 20% discount for annual payment improves cash flow dramatically, reduces churn by 30-40% (customers who've paid upfront rarely leave mid-year), and improves LTV. If you're not offering annual pricing, add it this week — it requires no research.
3. Making the free tier too good
A generous free tier that satisfies the core use case creates a product people love but don't pay for. The forcing function — the moment when the free tier is genuinely insufficient — has to arrive before the customer develops a "this is free" relationship with your product. Design the free tier to demonstrate value, not deliver it fully.
4. Anchoring on your own price sensitivity
Founders consistently underprice because they imagine themselves as the buyer and apply their own price sensitivity. You are not your customer. Your ICP has a different budget, different pain level, and different reference price. The survey methodology exists precisely to get their number, not yours.
5. Treating pricing as permanent
Customers forgive price increases when accompanied by clear communication and value delivery. What they don't forgive is feeling deceived. Document your pricing changes, communicate them clearly, and grandfather existing customers for a reasonable period. Pricing is meant to evolve — the mistake is either never changing it or changing it without a plan.
6. Optimizing for conversion instead of revenue
The price with the highest conversion rate is not necessarily the price with the highest revenue. If you drop from $79 to $29 and double conversions, you've cut revenue by 27%. The goal is revenue optimization, not conversion optimization. Test for revenue impact, not just conversion rate.
When You've Outgrown This System
You're doing $30K+ MRR and pricing is a full-time question. At this point, bring in a pricing consultant for a structured engagement. Simon-Kucher, Price Intelligently (ProfitWell), and Reforge's pricing curriculum are the standard references. A single pricing engagement at this stage can improve revenue 15-30%.
You need real-time pricing intelligence at scale. Tools like Klue ($500+/month) or Crayon ($500+/month) monitor competitor pricing pages, announcements, and positioning changes automatically and alert you to shifts. Overkill for a solo founder but justified at $100K+ ARR with an active competitive landscape.
You want behavioral pricing data, not stated preferences. The Van Westendorp survey captures what people say they'd pay. PostHog's A/B testing or Statsig capture what they actually do at different price points. Behavioral data is always more reliable — worth building the infrastructure for once you have sufficient traffic volume.
The Real Talk on Pricing
The Bessemer Venture Partners finding is worth repeating directly: find your pricing sweet spot through friction, not spreadsheets. Start with a price. If customers say "sold" immediately, you're too cheap. Raise incrementally until you hear "we have to think about that." Stop before it becomes a blocker.
That's not permission to raise prices arbitrarily. It's a description of how pricing signal actually works in practice. The spreadsheet tells you what the model should say. The customer's hesitation tells you the truth.
What the AI pricing workflow gives you is the scaffolding to get to that friction point faster and more systematically. Competitor normalization tells you the anchor range. Pricing hypotheses give you structured options. The survey or landing page test gives you signal before you commit. The quarterly review keeps the signal current.
The founders who treat pricing as a research discipline — not a launch decision — compound that advantage over time. Each quarter's experiment builds on the last. Each data point sharpens the picture. A year of structured pricing research produces a defensible, evidence-based strategy that a competitor who's been guessing cannot easily replicate.
Pick a hypothesis. Build the survey. Run one test.
That's it.


Comments (0)
Leave a Comment